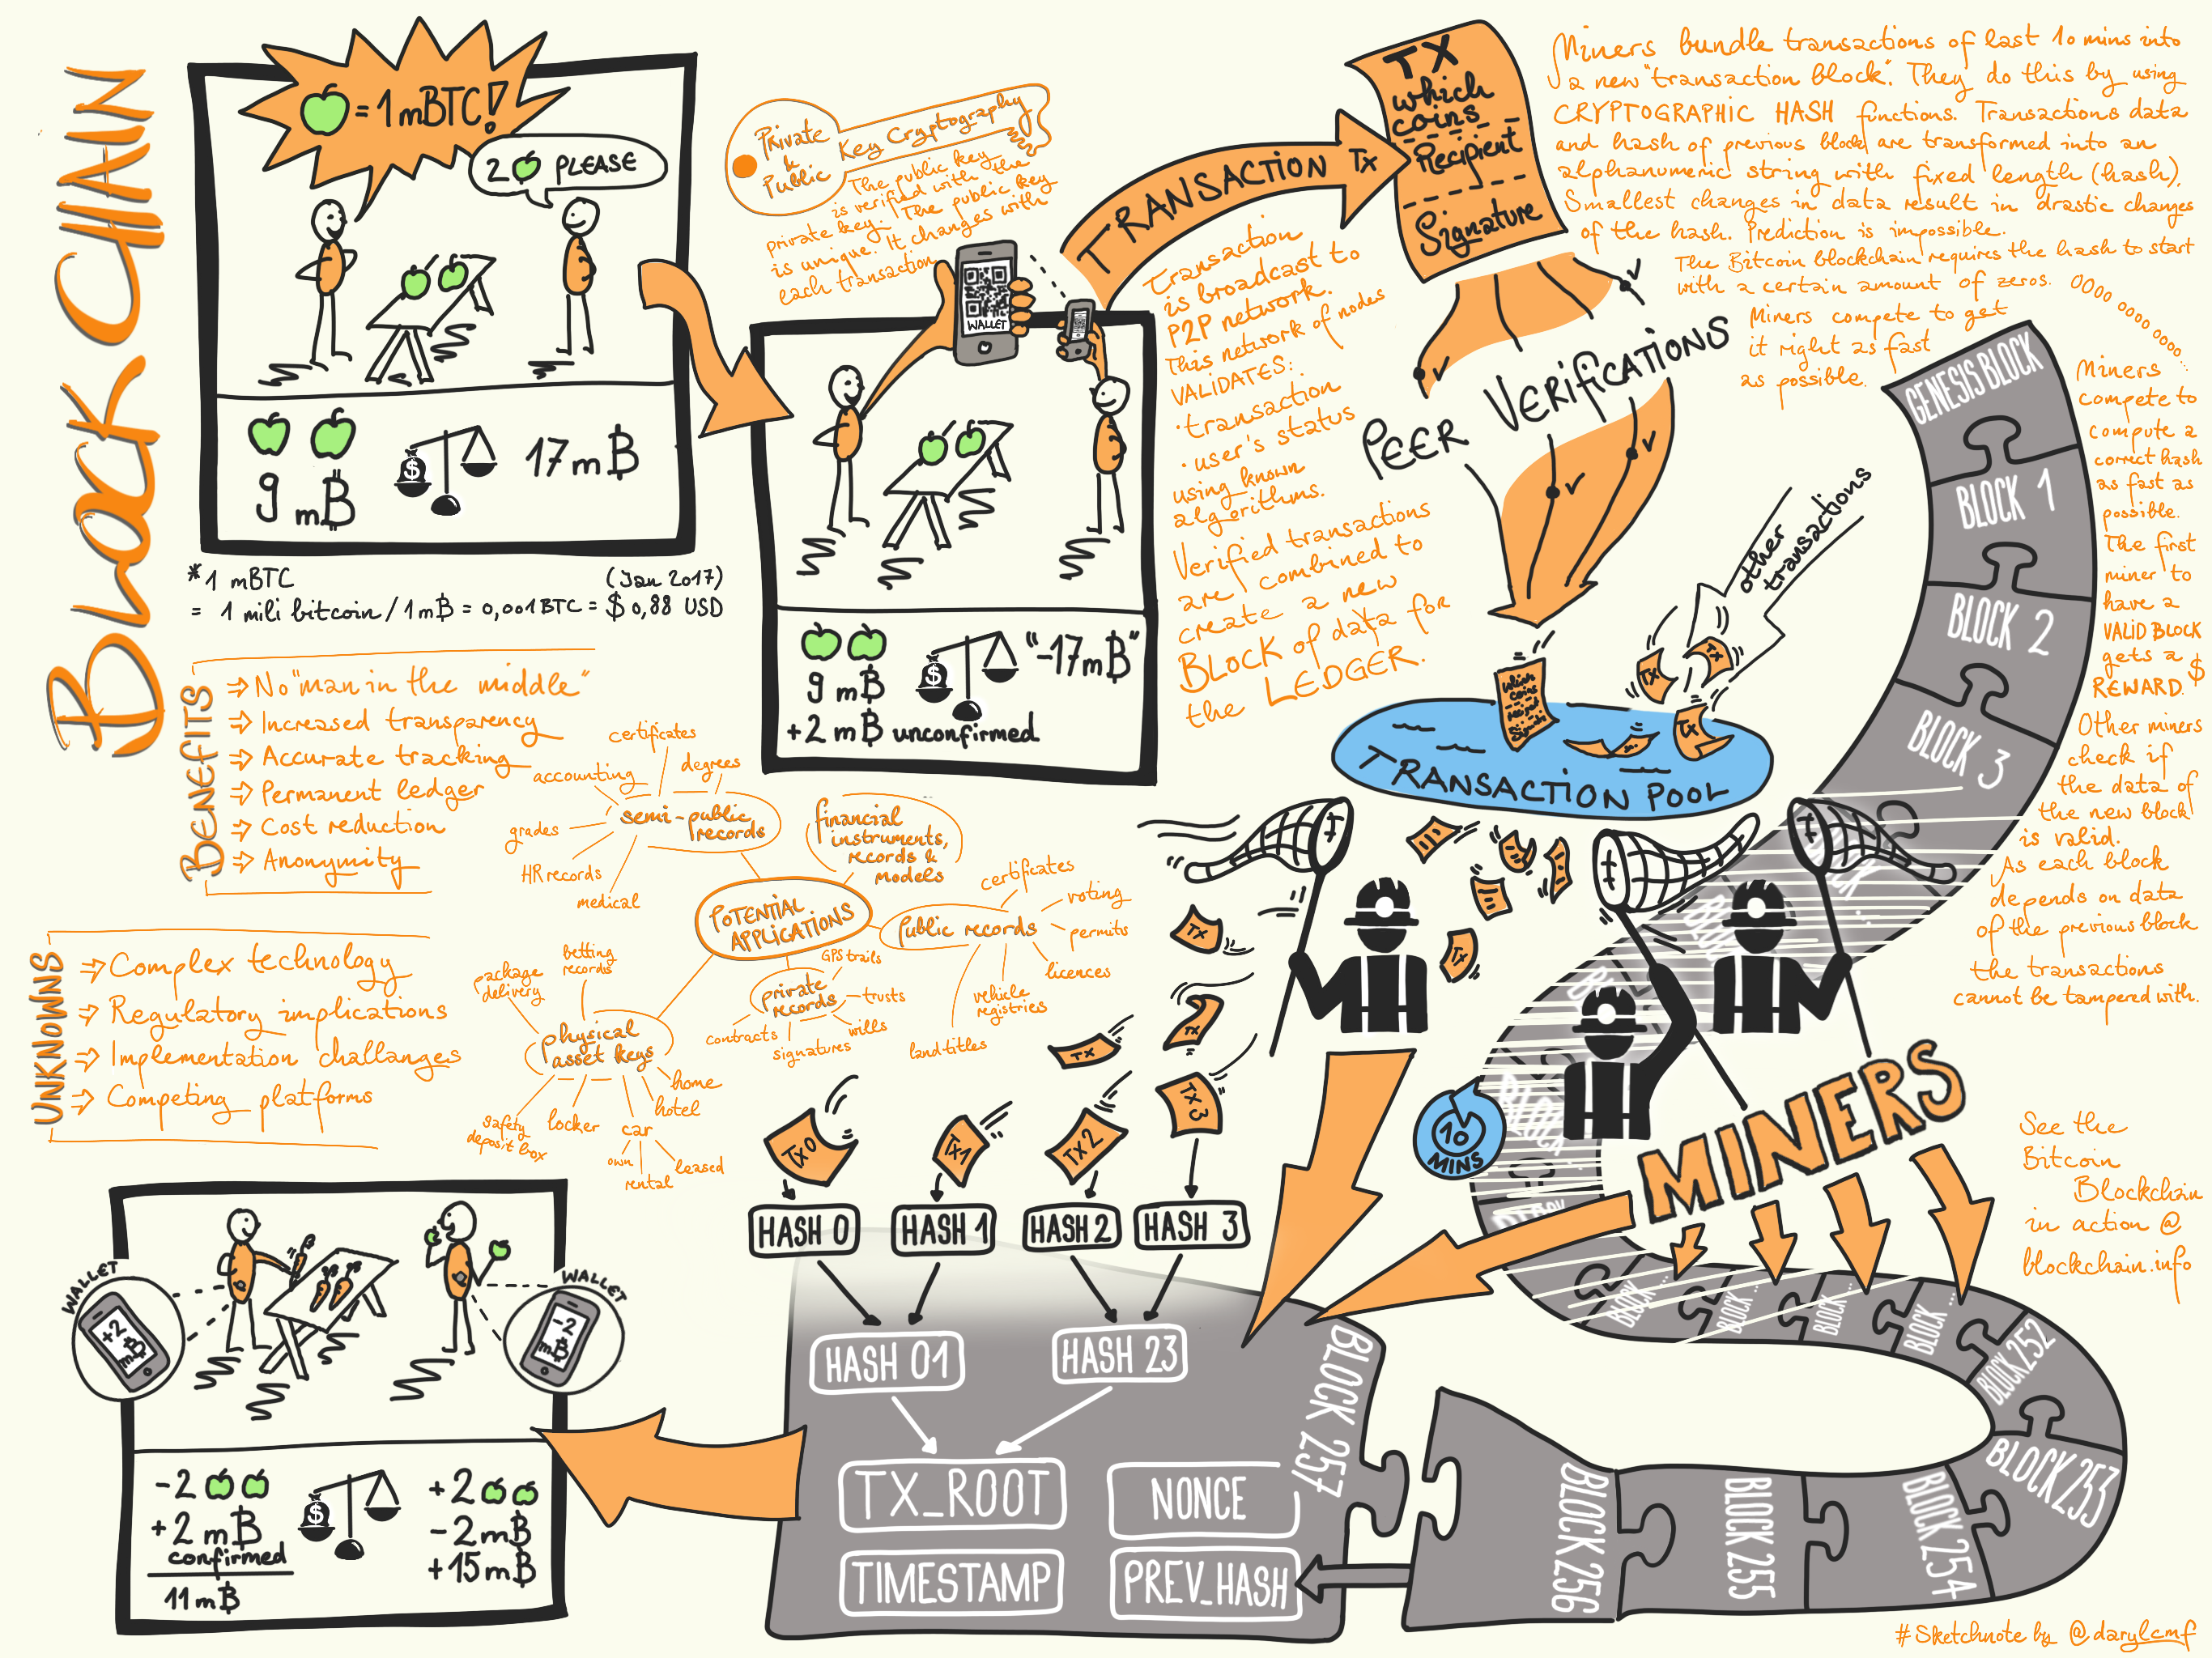
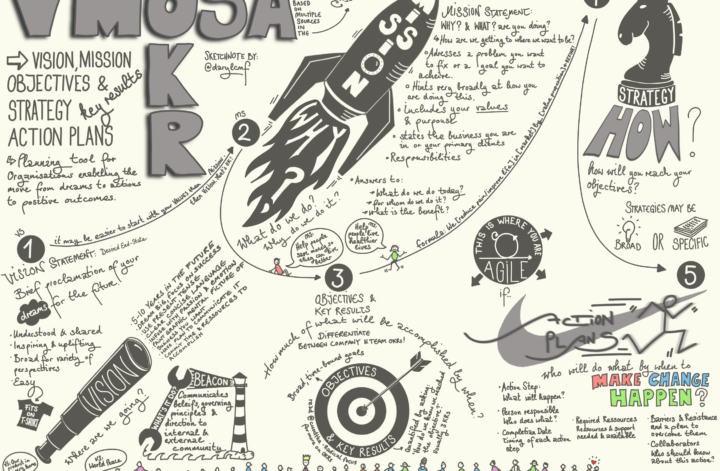
Infografik, Visualisations Blockchain January 12, 2017 No Comments Eine Visualisierung hilft, um Blockchain zu verstehen Das könnte dir auch gefallen December 12, 2016 Sketchnoting, Graphic Recording, Visual Facilitation – Was sind die Unterschiede June 12, 2017 Vision, Mission, Strategie & OKR May 12, 2019 Sketchnotes UX London 2019 Leave a Reply Cancel replyYour email address will not be published. Required fields are marked *Comment * Name * Email * Website Save my name, email, and website in this browser for the next time I comment.