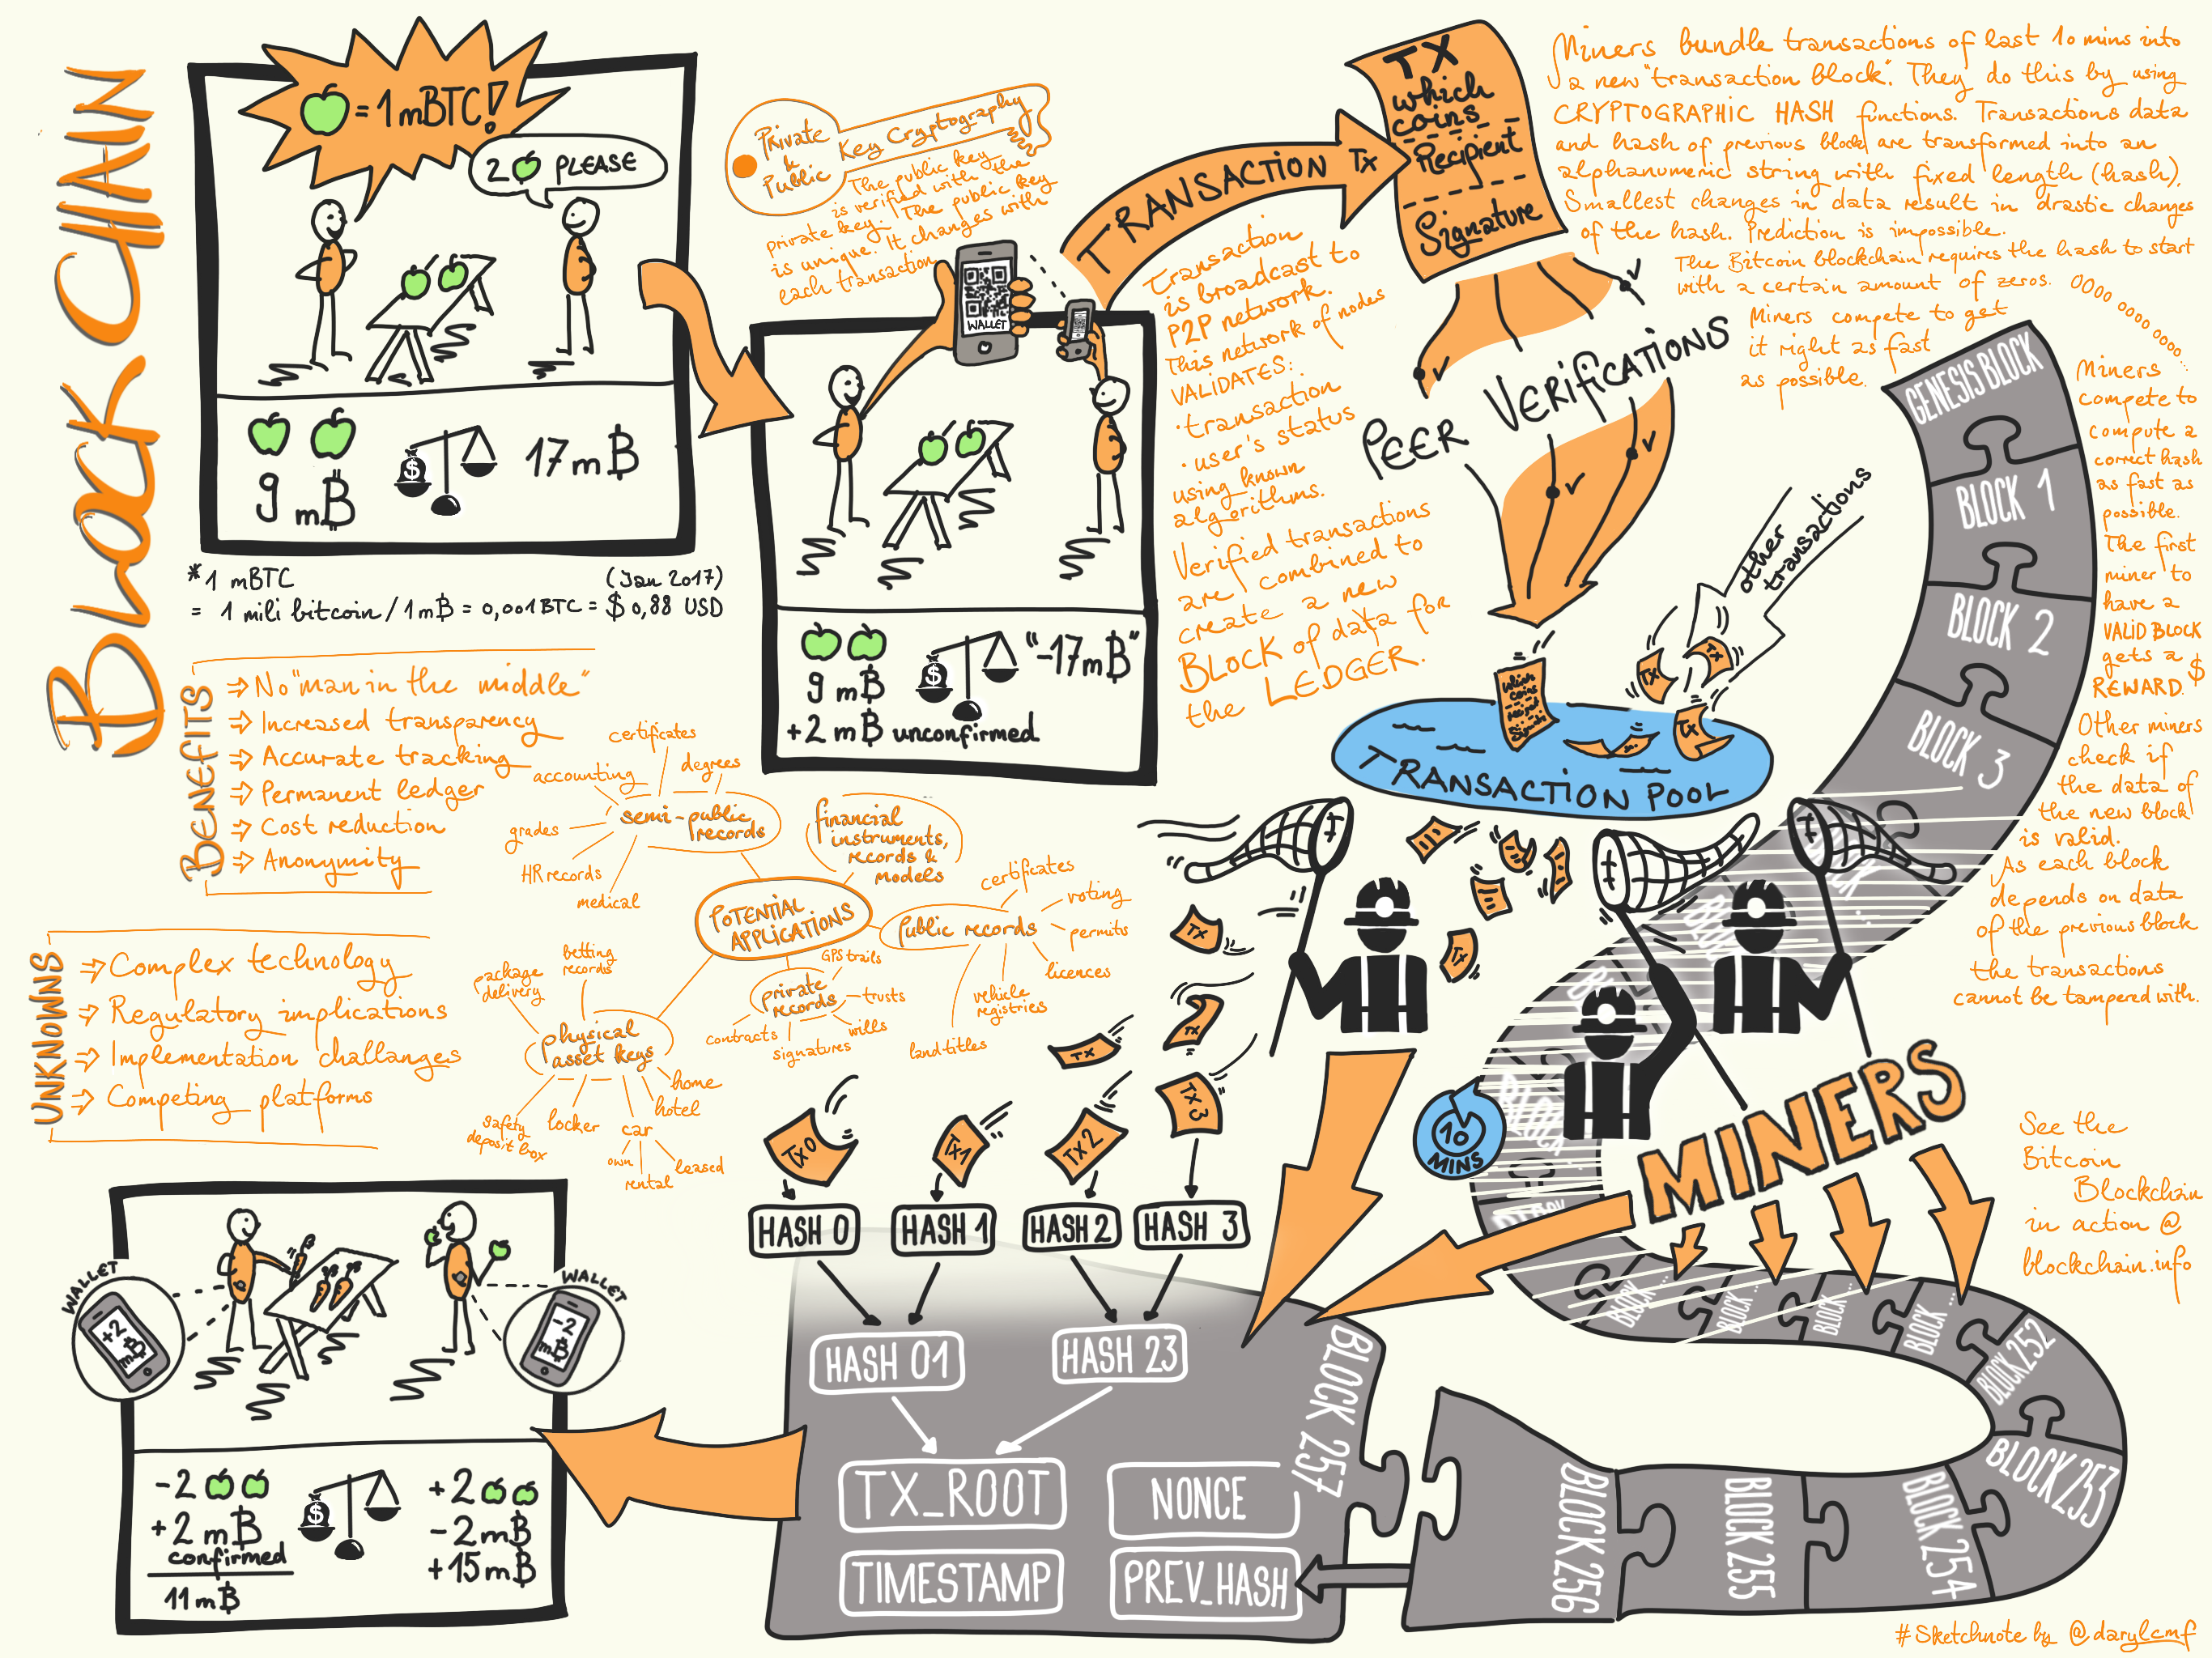
Infografik, Visualisations Blockchain January 12, 2017 No Comments Eine Visualisierung hilft, um Blockchain zu verstehen Das könnte dir auch gefallen May 12, 2019 Sketchnotes UX London 2019 October 12, 2016 Wie Profis recherchieren December 12, 2016 Sketchnoting, Graphic Recording, Visual Facilitation – Was sind die Unterschiede Leave a Reply Cancel replyYour email address will not be published. Required fields are marked *Comment * Name * Email * Website Save my name, email, and website in this browser for the next time I comment.