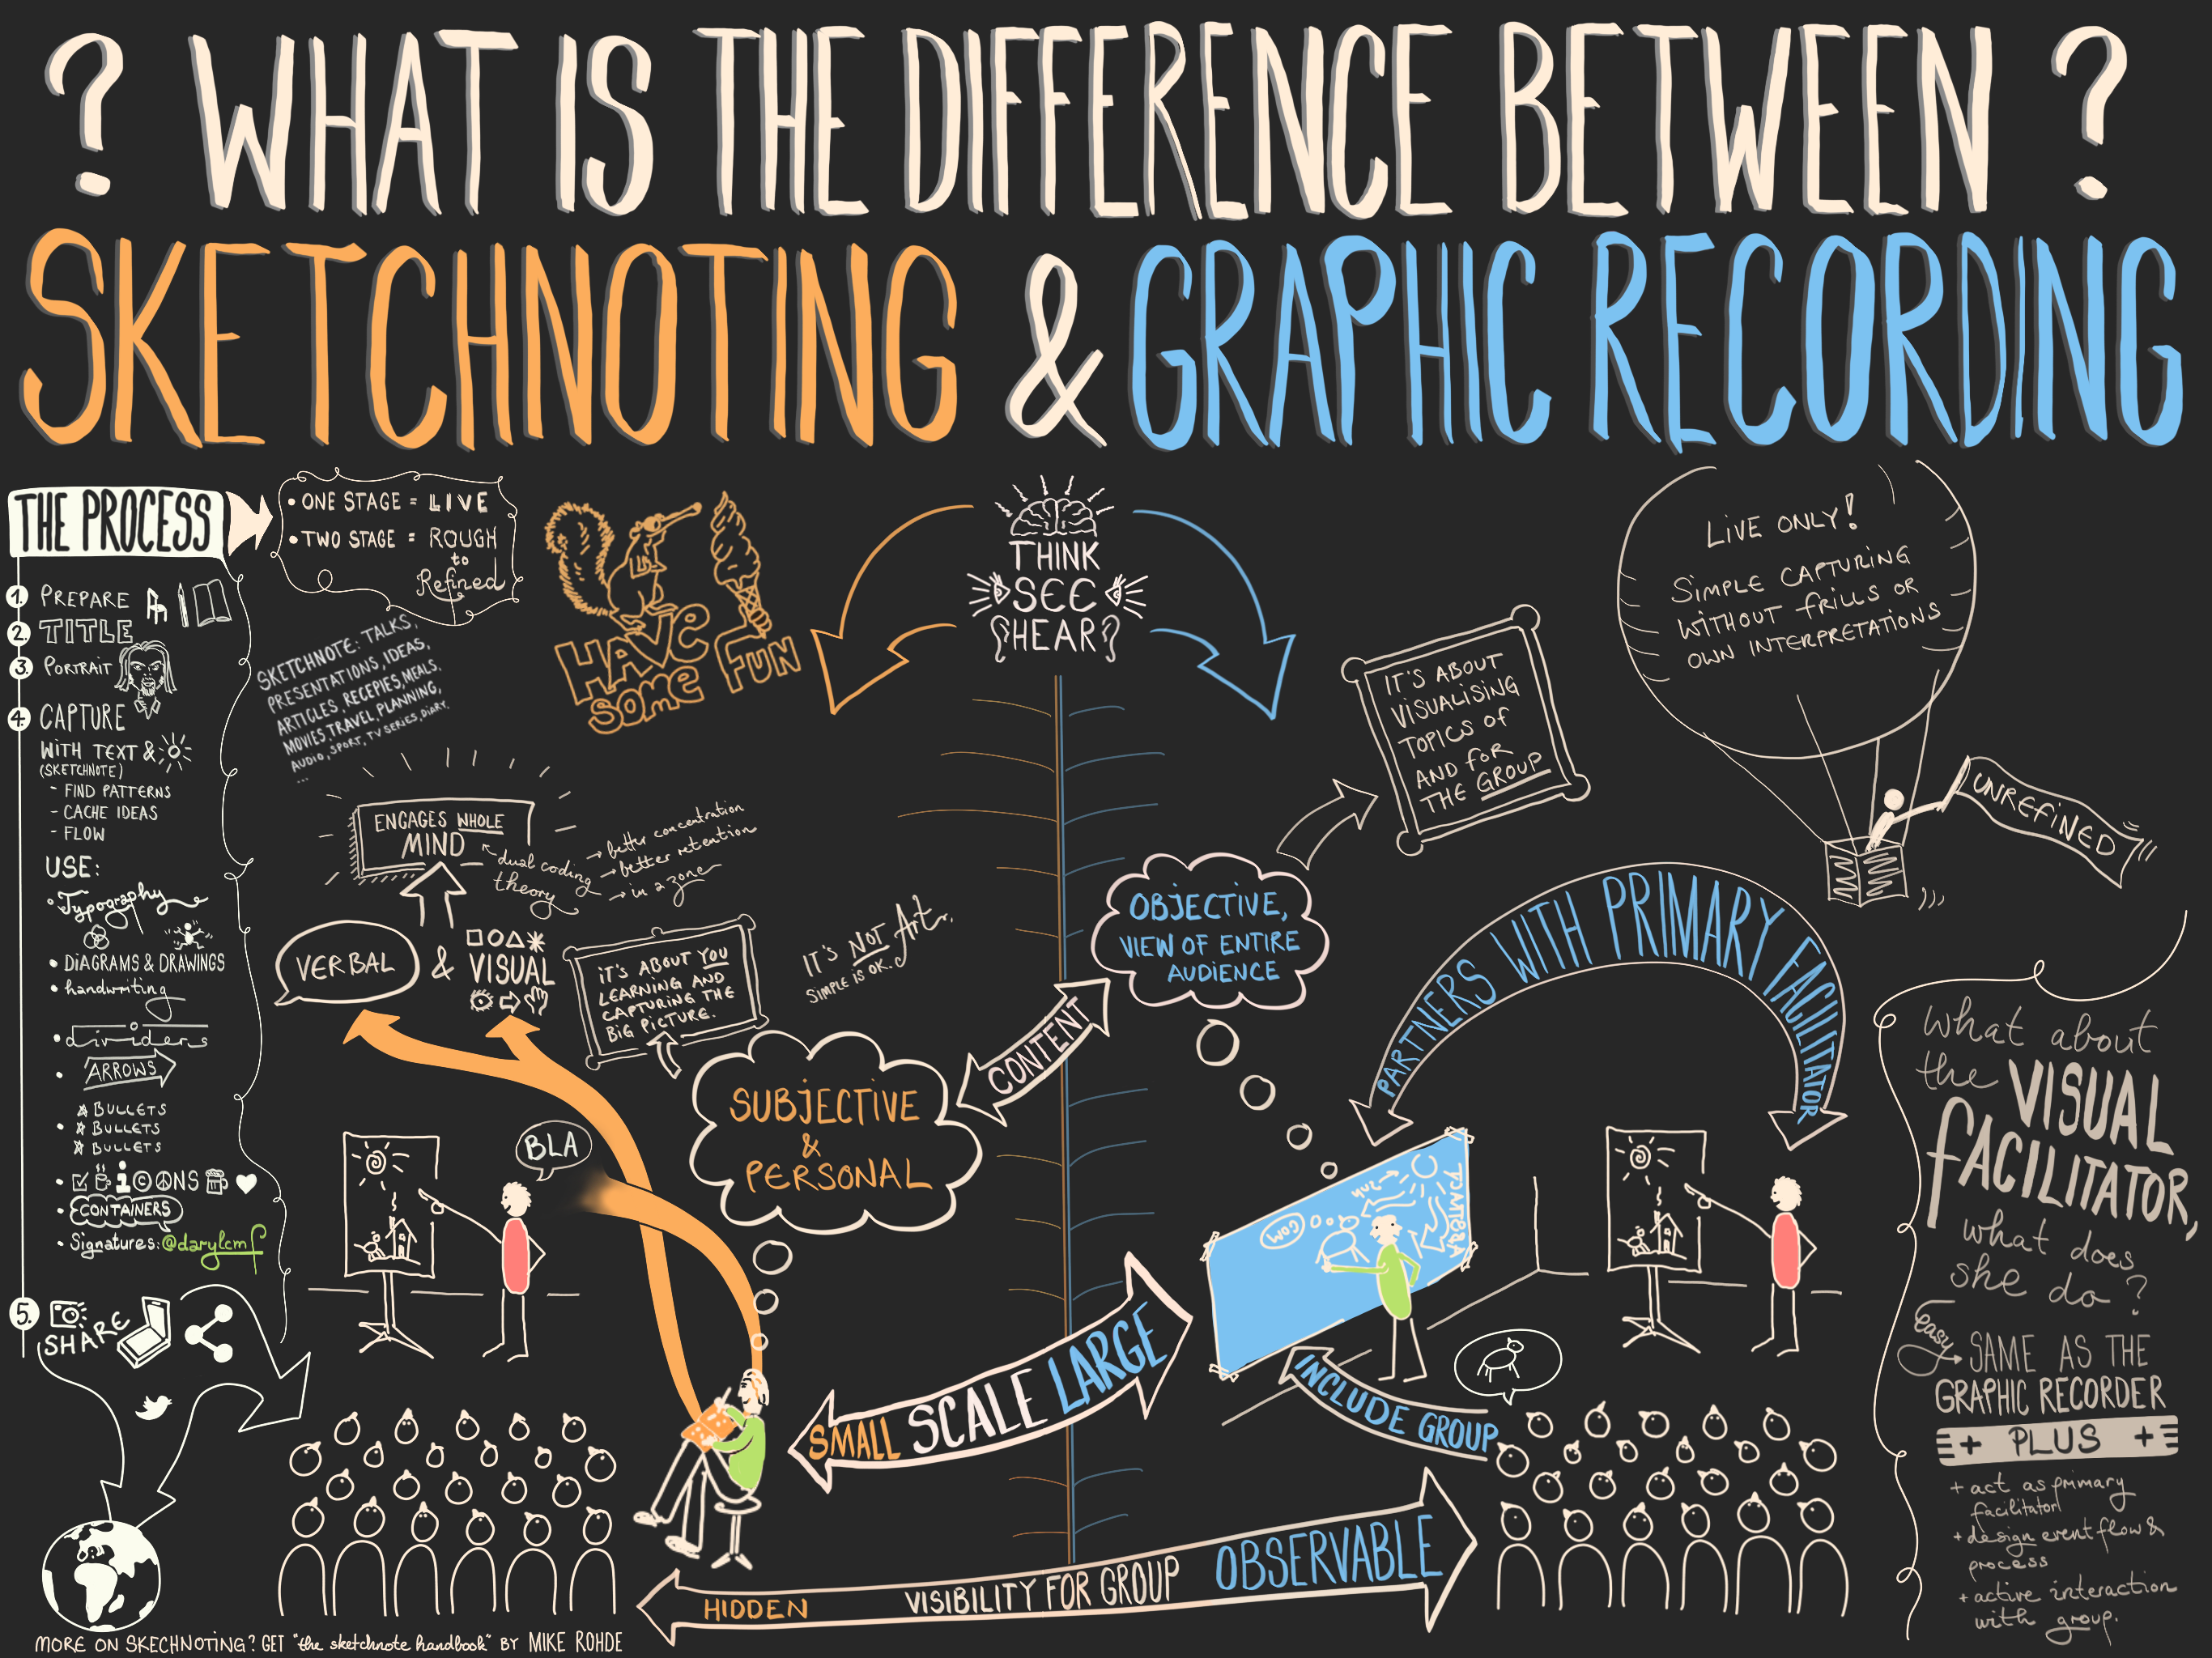
Das Visualisieren von Inhalten schafft Klarheit, hilft beim Lernen und ermöglicht Diskussionen. Die verschiedenen Formen werden in dieser Infografik kurz erklärt.


Emotions change the world

Das Visualisieren von Inhalten schafft Klarheit, hilft beim Lernen und ermöglicht Diskussionen. Die verschiedenen Formen werden in dieser Infografik kurz erklärt.